News that clears the bar
Only what actually moves the companies on your watchlist. Shareholder-alert spam and analyst noise dressed up as events are filtered out, and opinion is labelled as opinion.

For investors who already know what they own
Every report is drafted, challenged by a second AI editor, then rebuilt — you read the version that survived the argument. Every hard figure links to the SEC filing it came from, so you check the reasoning, not just the number.
Every company includes: profile report · earnings analysis · news summaries · data tables · charts · DCF · reverse DCF — key numbers in seconds, full reports in minutes.
Invite-only while we validate demand · leave your email and we'll be in touch
Trailing-twelve-month free cash flow of $3.1B covers the dividend 2.4× even after the acquisition closed — leaving the balance-sheet repair on schedule rather than at risk.
Only what actually moves the companies on your watchlist. Shareholder-alert spam and analyst noise dressed up as events are filtered out, and opinion is labelled as opinion.
Each deep dive is drafted, challenged by a second AI editor, then rebuilt on the notes. Hard figures come straight from the filings and link to the exact statement on SEC EDGAR.
Your growth, your discount rate, your terminal value — including a debt-paydown model most retail tools skip. Starting values come from the company’s own history, never a black-box forecast.
See it working
No mockups — this is the actual product, cropped straight from the app.
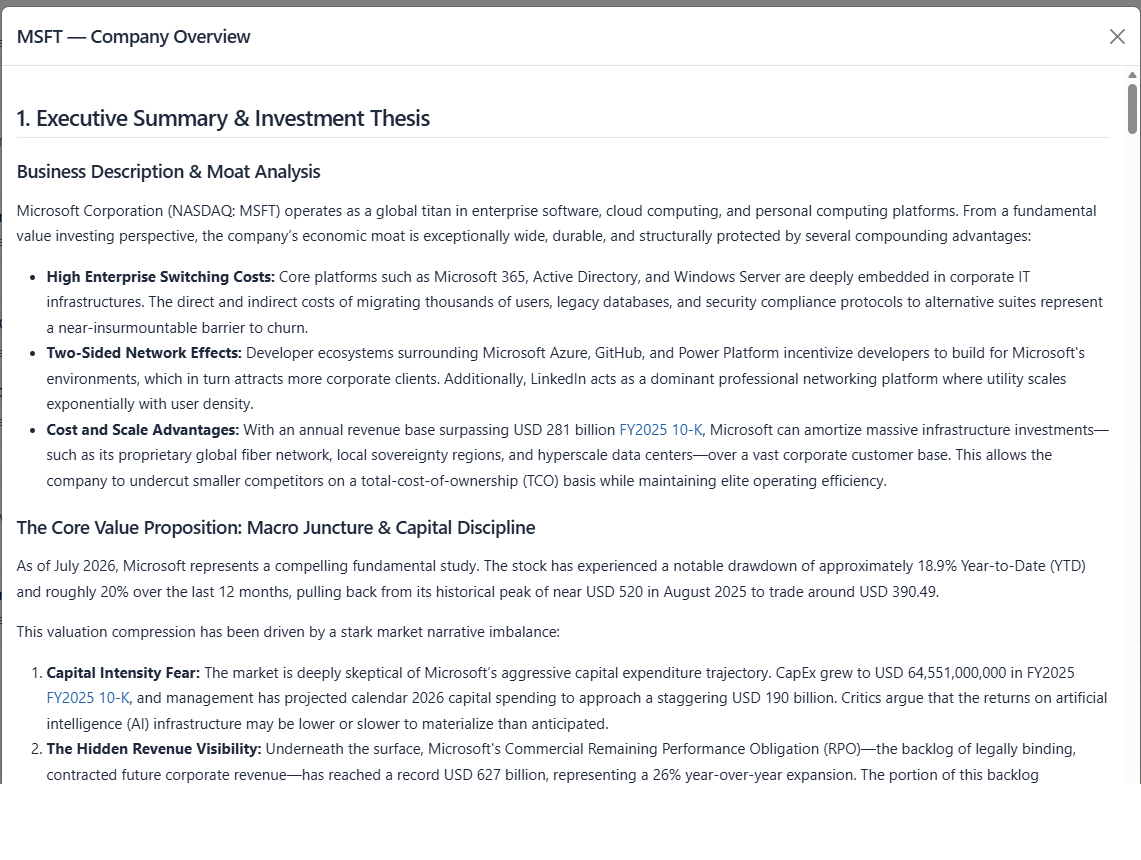
A report that shows its sources.
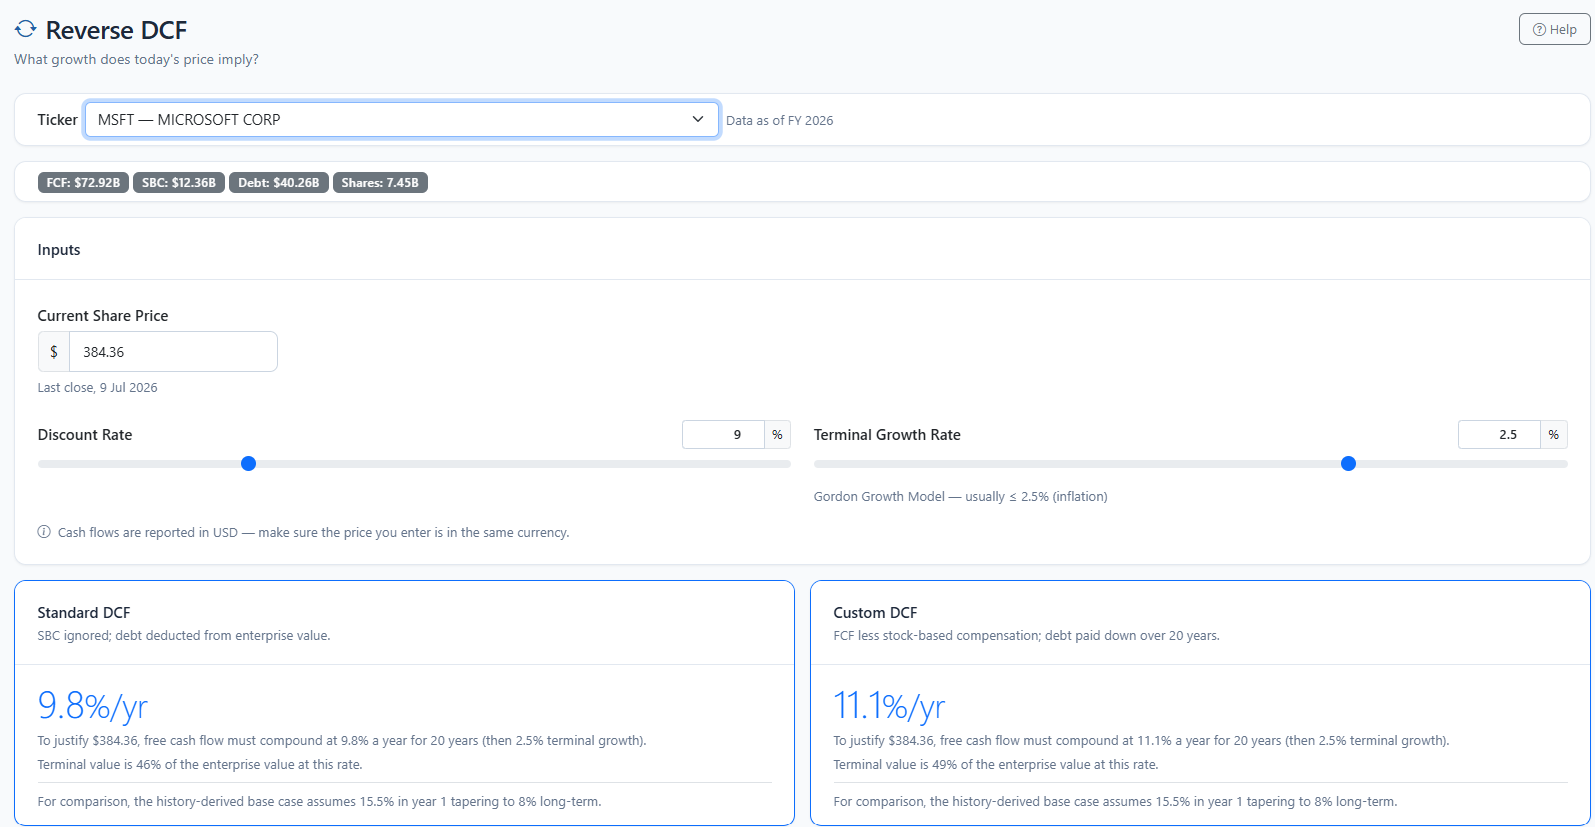
What growth does today’s price imply?
How it works
The data is a commodity — the rigour is the product. Two things make a Verametric report worth trusting more than a single AI pass:
We pull the company’s filings and financials ourselves before any drafting starts, and hand the model that verified data set to work from. A first draft is written, then a separate editor model challenges it for promotional tone, weak claims and gaps — and the report is rebuilt on that critique before you ever see it.
Financial figures are pulled directly from filings and carry their source — click a number to open the exact statement on SEC EDGAR. Web-sourced claims are marked as such, so you always know where a figure came from.
What happens once you're in
Add a company — the key numbers appear immediately, and most companies already have a full report waiting.
If we haven't covered a company before, its full analyst-grade report is drafted, critiqued and rebuilt while you watch.
An email covering only what actually moves the companies you follow.
Add your watchlist, and get a second read you can actually check.
Not investment advice. Everything here is for information and research only. Full disclaimer ›